
For guidance on creating a survey, check out the How to Create a Survey guide
To deep-dive into how each result is calculated, check out the How Survey Results Are Calculated guide.
For guidance on editing an existing sequence or building a new one, check out the How to Create or Add a Sequence and How to Edit an Existing Sequence guides.
Watch this video explainer instead:
Viewing a Survey Report
⚠️ The report is only available once the survey has closed. While the survey is still open, View Report is greyed out. Need the report sooner? See Closing a survey early to see the report.
- In the top navigation bar, click Insights, then Surveys.
- Select the survey you'd like to review.
- Click the View Report button.

Closing a survey early to see the report
If you need the report before the survey's close date, you can close the survey early:
- Open the survey and click Edit survey.
- Set the Close Date to one minute from now.
- Click Review & Republish.
- Wait a minute, then refresh the page. View Report is now available.
Closing a survey stops anyone else responding. If some classes still need to finish, click Remind teachers on the survey's Responses tab first, and close it once they're done.
Each survey’s report contains four sections:
Glossary of Key Terms
- Baseline Survey: A comprehensive survey conducted once or twice a year.
- Trend Survey: A shorter follow-up survey analysing specific targeted factors.
- Wellbeing Factor: A specific category or theme that serves as a key driver of wellbeing.
- Favourability Percentage: The percentage of students that responded favourably to a question (answering either “Agree” or “Strongly Agree”).
- Index Score: A single percentage summarising overall results across all respondents in the index factor statements- 'Wellbeing Skills'
- Factor Score: The average favourability percentage for all questions linked to the factor.
Summary
Provides key insights at a glance to help you effectively target your wellbeing initiatives:
- Index: A single score (out of 100) that represents overall student wellbeing.
- Trends (e.g. What you’re doing well and Your Top Opportunities): identifying key themes across the school
- Cohort Spotlight: Insights into which year levels are excelling or need extra support.
- Student Spotlight (for non-confidential surveys only): Identifying individual students who are thriving, or may require targeted support.
1. Index
Provides an overall Index Score out of 100 for your school on the particular survey being delivered.
 Sample score for the Wellbeing Skills Index survey
Use Index data to:
- See if overall student wellbeing is improving by benchmarking and comparing your Index Score with past surveys
- Set school-wide wellbeing goals by using this score as a key indicator to drive decision-making and resource allocation.
- Inform broader wellbeing strategies by bringing the Index Score into leadership discussions
2. Trends
Provides a high-level view of cohort trends, segmented by favourable, neutral and unfavourable responses to individual questions.

Sample Trends for a Wellbeing Skills Index survey
3. Cohort Spotlight
Recognises year levels that are excelling and identifies those needing additional support as identified by their favourable responses in the Wellbeing Skills index statements.

4. Student Spotlight (Non-Confidential Surveys Only)
Highlights individual students who are doing well and those who may require intervention.

Participation
View survey participation by year level, including the number of students invited and the number of students who responded. This will help you get a sense of how representative cohort-level results are for each cohort.

Heatmap
This section provides a high-level summary of each key wellbeing factor, with specific questions organised by sequence or year level
To explore the data in more detail, click a factor's name to see its statements. The other rows fade back so you can focus on that factor.
Choose sequences or year levels
The heatmap sits under Results by group. Use the Sequences dropdown above the heatmap to switch the columns between sequences and year levels. The heatmap opens on sequences when at least one sequence has answers, and on year levels otherwise.
Your school plans its teaching by sequence, so the sequence view shows you which sequence needs the most support.
Actual or Delta
Use the toggle on the right to switch between two views:
- Actual: the percentage of students in that group who answered positively.
- Delta: how many points that group sits above or below the average for everyone in the survey.
The description above the heatmap changes to explain the view you've chosen.
Use Heatmap data to:
- Compare wellbeing trends across different sequences and year groups.
- Drill down into specific wellbeing factors to identify key areas of strength and focus within each cohort.
- Refine your wellbeing strategies and adjust lesson plans or interventions for targeted wellbeing outcomes.
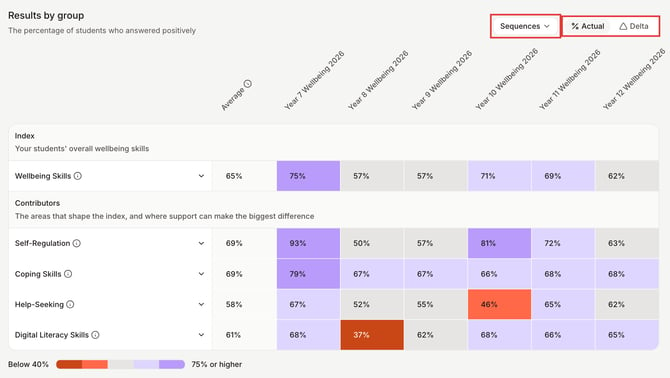
Click a factor's name to see its statements
How to interpret this data:
- The Average next to each factor is the average Factor Score for everyone in the survey. Hover over the info icon next to Average for an explanation.
- In Actual, each column shows that sequence's or year level's own Factor Score.
- In Delta, each column shows how many points that group sits above or below the Average.
- The table has two parts: Index (your students' overall wellbeing skills) and Contributors (the areas that shape the index, and where support can make the biggest difference).
- Hover over the info icon next to a factor's name to see what that factor measures.
When you click a factor's name, each statement shows its own favourability percentage in the same way.
What the colours mean
Coral shows results that need attention, grey is in the middle, and violet shows strong results:
- Below 40%: dark coral
- 40–49%: coral
- 50–64%: grey
- 65–74%: light violet
- 75% or higher: violet
In Delta, the same colours mean below average, close to average and above average. The legend under the heatmap lists the ranges, and every cell shows its number too.
Schools in Indonesia answer on a four-point scale, so their colours use their own ranges. Check the legend under your heatmap.
Why does a column show a dash?
A dash on a striped grey cell means nobody in that sequence or year level has answered yet. Hover over it to see No answers. These columns stay on the heatmap so you can see who the survey was for and who still needs to complete it. To remind them, click Remind teachers on the survey's Responses tab.
Can't see all the columns?
If there are more columns than fit on screen, scroll sideways using the scroll bar under the heatmap. Factor names stay pinned on the left. Long sequence names are shortened; hover over one to see the full name.
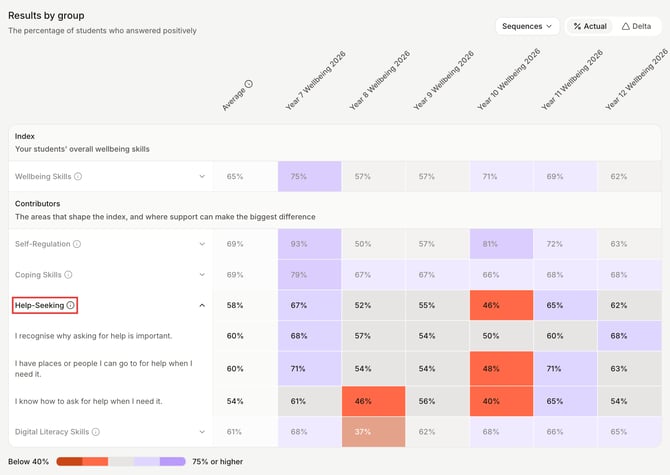
Breakdown of Heatmap data from the Wellbeing Skills Index survey
Students
This section provides a high-level summary of student wellbeing data and becomes particularly valuable when the survey is not confidential. In these cases, you can expand each year level to identify key areas of focus for individual students, enabling targeted insights, intervention, and personalised support.
Use this Students data to:
- Compare individual student scores to the cohort average and provide targeted wellbeing interventions.
- Track students’ progress and changes in individual wellbeing over time to assess intervention effectiveness.
- Collaborate with classroom teachers to provide additional support to students showing lower wellbeing scores.
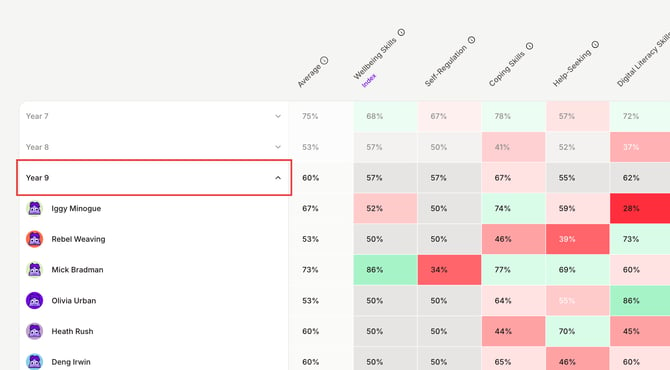
Expand each Year Level to view individual student responses
How to interpret this data:
- The "ALL" percentage next to each year level represents the average Factor Score for the entire year level
- Each factor column displays a % indicating how that factor score compares to the overall average.
When a year level is expanded:
- The "ALL" percentage next to each student represents the average Factor Score for the individual student
- Each factor column displays a % value indicating how that factor score compares to the student’s overall average.
Can I export survey results as a CSV or PDF?
Not at the moment. Survey results and the survey report can't be exported or downloaded from Wellio as a CSV, PDF or other file. You can view the report in Wellio once the survey has closed.
Need survey data for a board report, or a breakdown the report doesn't show (for example, by class or by question)? Contact Wellio Support and tell us what you need. We'll put together a custom data export or insights for you.
Where can I find more help reading my results?
Click the info button at the top of the report to open How to read your survey results.